| DataLab is a compact statistics package aiming at exploratory data analysis. Please visit the DataLab Web site for more information.... |
Home  Programming DataLab DLabPascal ChartBook Chartbook Programming DataLab DLabPascal ChartBook Chartbook |
||
See also: Using the Charts, Configure
 |
||
  |
||
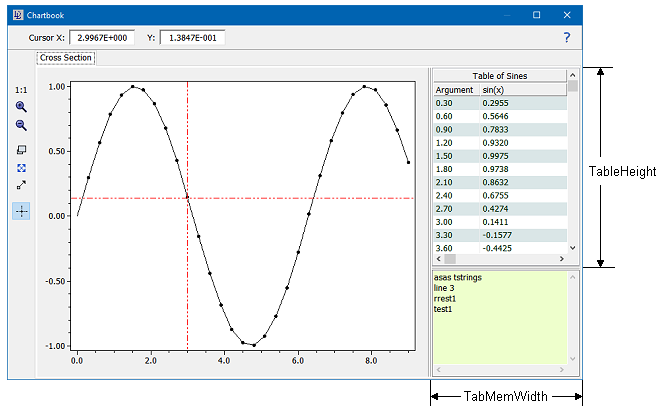
ChartbookDataLab provides a general data display tool called ChartBook which is able to displaying x-y plots along with data tables and unformatted text. The ChartBook is organized in eight tabsheets, each of which contains the above mentioned components. The visibility of the components and their sizes can be freely configured to reflect the user's needs.
For a programmer's introduction to working with the charts, tables and memo fields, see the section Using the Chartbook. A table of all available properties and methods can be found in the ChartBook Overview. |
||