3D Rotation
| Command: |
 Visualisation -> 3D Rotation Visualisation -> 3D Rotation |
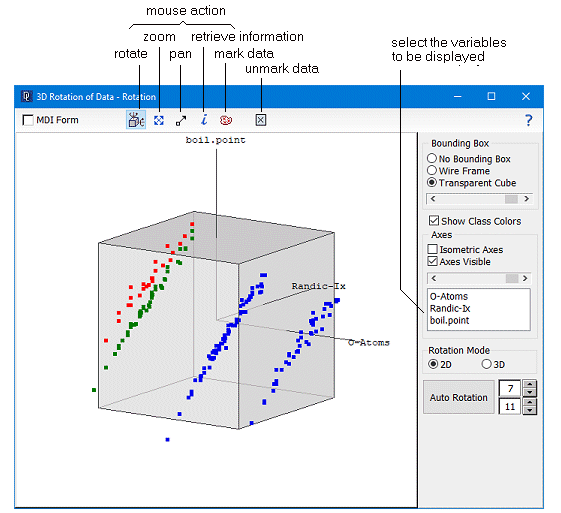
DataLab provides a way to look at three variables simultaneously by using a rotating display. The command Visualisation/3D Rotation supports the on-screen rotation of a 3-dimensional sub space of the data matrix. Therefore three variables of the data matrix have to be selected. All objects (rows) of the data table are then projected from this 3-dimensional space onto the (2-dimensional) screen. The selected variables are scaled to zero means. The direction of the projection (rotation) can be adjusted by using the mouse. After clicking "3D-Rotation" the first three variables are selected by default

The 3D rotation is controlled by several parameters shown in the right part of the window, and by a popup menu which shows up when the right mouse button is pressed:
The popup menu contains the following commands, the first six of them being also available via speed buttons at the top of the window:
| Rotate |
 |
The rotation can be controlled by pressing and holding down the left mouse button and moving the mouse. The projection of the 3-dimensional sub-space closely follows the movement of the mouse cursor. Horizontal movement corresponds to the rotation of one axis, vertical movement to the rotation of another axis. In this way the 3D sub-space can viewed from any direction. |
| Zoom |
 |
The display can be zoomed in and out by moving the mouse up and down when pressing the left mouse button. Please note that the zoom factor is also linked to the mouse wheel. Thus you can zoom in and out simply by using the wheel (no matter whether the zoom button is selected or not). |
| Pan |
 |
The position of the displayed data can be moved across the 3D chart area by dragging the whole image. |
| Info |
 |
When Info is active, you can click a data point. The nearest data point is identified and its coordinates and the object name are displayed in an inserted info window. |
| Mark Data |
 |
You can draw a lasso line around data points to be marked. Clicking the "Mark Data" button toggles between red and blue marks. |
| Unmark All Data |
 |
Resets all cells states to unmarked. |
| Copy to Clipboard |
|
Enables the user to create a copy of the current 3D image in the clipboard. |
| Save As File |
|
Saves the current 3D plot on a file (BMP, PNG or JPG). |
The right panel of the 3D window provides the following controls:
| Bounding Box |
The display of the data can optionally be accompanied by a wireframe or by a transparent cube. This enhances the 3D effect for unexperienced users. The size of the cube may be controlled by the scrollbar. |
| Axes |
Any of the three axes can be assigned to any variable of the data matrix. Simply click the name of the axis to be changed and select a new variable for it. The axes may be also switched off completely. The display may be chosen to be either isometric (thus showing the actual relationships more clearly) or equally scaled. |
| Rotation Mode |
The Rotation Mode box controls how the three-dimensional data is rotated (i.e. which axes are used for rotation).
|
| Auto Rotation |
When activating this feature the data are rotated automatically. The rate of rotation can be set up by entering suitable numbers to the two numeric input fields to the right of the Auto Rotation button. Higher values speed up the rotation in the corresponding direction. |
| Hint: |
The command 3D-Rotation needs lots of processing power. It is recommended to use a fast graphics card. |
|

 Features of DataLab
  Displaying Data
  3D Rotation


 Visualisation -> 3D Rotation


