Create a PLS Model
| Command: |
 Math -> Multiple Regression -> Partial Least Squares Regression -> Calculate Model... Math -> Multiple Regression -> Partial Least Squares Regression -> Calculate Model... |
DataLab offers, among several other model building methods, Partial Least Squares (PLS Regression) which can be opened by the command Math/Partial Least Squares.... The PLS methods used in DataLab is based on the SIMPLS algorithm which covers both PLS1 and PLS2.
In order to create a model one has to specify both the independent and the dependent variables by clicking the corresponding fields at the top left and the top left, respectively. Further one can select one of two scaling options: "mean centering" and "standardization". The first method is the standard PLS approach.
After selecting the variables the PLS calculation can be performed by clicking the "Calculate" button. The PLS algorithm works on a number of predefined factors (default is currently 20) which, of course, also depends on the dimension of the data matrix. Thus the number of actual factors may decrease in some cases.
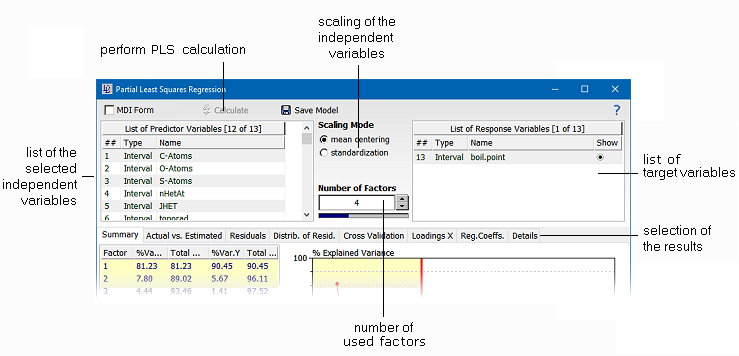
After the successful calculation of the PLS model it can be stored on disk (button "Save Model") for the later application to new data. Further, the following information is available on different tabs:
| Summary |
A list of the amount of variance explained by each factor (both for the independent and the target variales). Factors which do not exists (due to collinear variables) are indicated by a series of stars. In addition, the explained variances are displayed in the diagram to the right of the factor list. This diagram immediately shows how many factors are required to build up a PLS model.
|
| Actual vs. Estimated |
This tab shows the actual values of the currently selected dependent variable plotted against the estimated values. In order to select a different target variable you have to select it in the column "Show" of the list of reponse variables. The number of factors used for a particular model can be adjusted by the slider "Number of Factors".
|
| Residuals |
Displays the residuals of the currently selected response variable at the partical number of factors given by the control "Number of Factors". |
| Distrib. of Resid. |
Displays the distribution of the residuals of the currently selected response variable at the partical number of factors given by the control "Number of Factors". |
| Cross Validation |
This tab is to be used for cross validating the PLS model against the number of factors. Both the size of the test set and the number of repetitions can be set by the user. If the test set size is set to 1 (full cross validation) the number of repetitions is ignored since repetitions are not meaningful.
|
| Loadings X |
Displays the loadings of the independent variables as a spectral plot. |
| Reg.Coeffs. |
Displays the regression coefficients of the model as a spectral plot. |
| Details |
Provides a list of details on the PLS results. |
| Hint: |
The calculation time of PLS is approximately proportional to the number of factors times the number of target variables times the square of the number of input variables. Thus it is a good idea to restrict the number of input variables to less than 1000 (if possible). Example: taking 10000 input variables instead of 1000 increases the calculation speed by a factor of 100. |
|
 Features of DataLab

