| DataLab is a compact statistics package aiming at exploratory data analysis. Please visit the DataLab Web site for more information.... |

Home  Features of DataLab Features of DataLab  Tools Tools  Baseline Correction Baseline Correction |
||||||
See also: EstimateBaselineOfSignal
 |
||||||
Baseline Correction
DataLab offers several ways to correct the baseline of a signal: the user may select either from polynomial fits through pivot points, from a penalized spline through pivot points, from the Lieber algorithm [Lieber 2003] or from an asymmetric least squares approach (Eilers algorithm,[Eilers 2005]). The basic idea behind the baseline correction (using polynomials and splines) is the construction of a baseline by interpolating up to 30 pivot points along the x-axis of the spectrum. The pivot points can be edited interactively (add, remove, adjust position) by clicking and/or dragging the pivot points directly in the spectrum. The y-value of each pivot point is determined by the mean of k neighboring values. The number of neighbors can be specified by the user ("Neighborhood" control). Further, the order of the polynomial and the "stiffness" of the spline can also be adjusted. Please note that the stiffness parameter allows you to vary the spline-based interpolation between a normal spline (stiffness = 0.0) and a linear regression line (stiffness = 1.0).
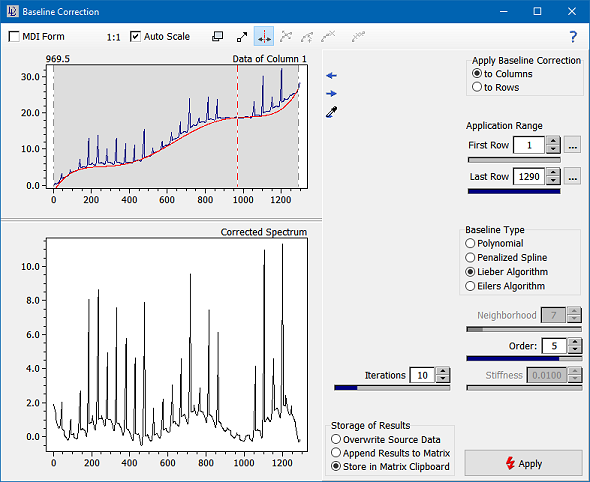
The algorithm of Lieber is an iterative one. It uses a polynomial interpolation of all data points, cutting all data points above the current interpolation curve and setting them to the corresponding points of the polynomial. After n iterations the algorithm converges forming a polynomial baseline of order d. Both the number of iterations n and the order of the polynomial d can be set by the user.
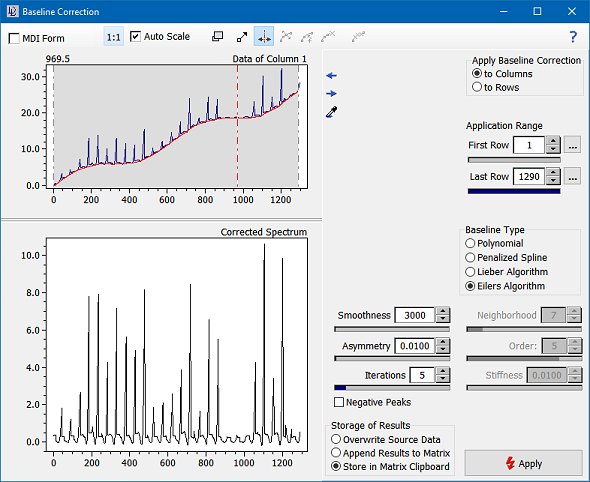
In many cases the best way to correct the baseline is the asymmetric least squares approach developed my Eilers et al. However the Eilers algorithm is the slowest of all options. The basic idea of this approach is to weight low intensities more strongly than high intensities ("Asymmetry" control). Together with a regularisation parameter ("Smoothness") this algorithm generates a smooth baseline which adapts itself to the given data. Typical values for the two parameters are 0.001 for Asymmetry and 100000 for Smoothness.
|
||||||


 Tools > Baseline Correction

