| DataLab is a compact statistics package aiming at exploratory data analysis. Please visit the DataLab Web site for more information.... |

Home  Features of DataLab Features of DataLab  Mathematical/Statistical Analysis Mathematical/Statistical Analysis  Statistics Statistics  Univariate Descriptors Univariate Descriptors |
||||
See also: Numeric Data Editor, Context Menu of the Numeric Editor, Frequency Tables, Box Plots
 |
||||
Univariate Descriptors
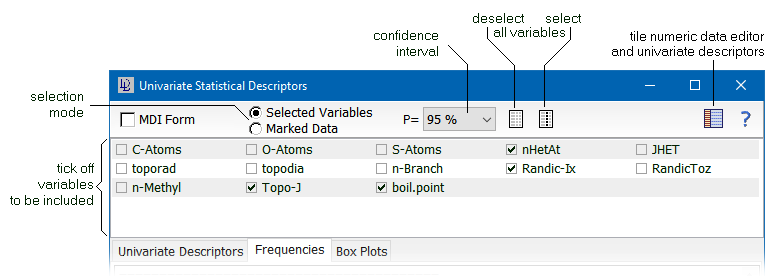
In order to calculate the basic univariate descriptors of a dataset, you may issue the command Math/Univariate Statistics/Univariate Descriptors.... After issuing this command, the calculated parameters are displayed in a table. The descriptors can be calculated either of selected variables (columns of the data matrix) or of marked data.
The following table lists the calculated univariate descriptors:
The confidence level of the confidence interval of the mean can be selected in the top region of the window (the drop-down box offers the most common statistical securities between 90% and 99.99%. In addition to the calculated parameters both the frequency tables and the box plots are displayed on separate tabs. |
||||


 Math -> Univariate Statistics -> Univariate Descriptors...
