Numeric Data Editor
| Command: |
Edit -> Data -> Numerical |
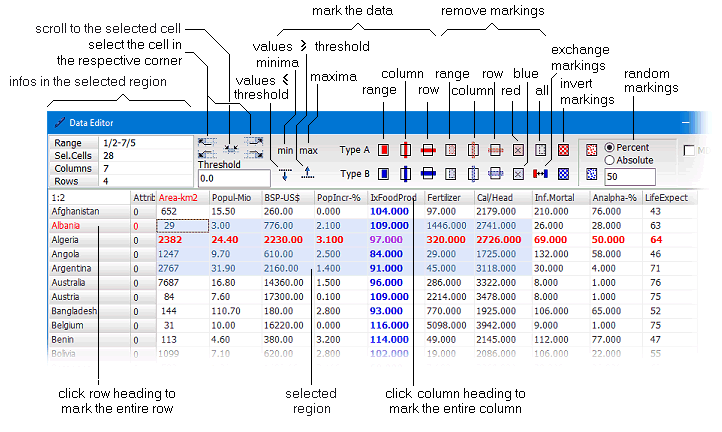
The numeric data editor displays the data matrix as a numeric grid. The editor displays also the row and column headings and the class attributes of the samples (rows). They may also be edited directly within the data editor (see below). Apart from editing purposes the editors can also be used to mark specific elements of the data table.

| Editing and entering data |
Click the cell to be edited and input the new data. Pressing the Enter key advances the cursor one line down (the automatic advancement can be adjusted in the general settings). This feature may be used to input a larger number of data into a single column. In order to change the column or row headings, or the class attributes you have to right-click the appropriate cell. By clicking such a cell, a little editing box is opened which lets you input the new identifier. Note, that headings and class numbers may also be entered in the matrix view window. |
| Highlighting and marking |
The numeric data editor uses two different levels of marked cells in the table. There is (1) an auxiliary marking ("selection of the cells") which is not permanent and only valid for the next command issued via the context popup menu (acccessible by a right mouse click). (2) In order to make some marking permanent you have to click Mark/Unmark commands of the context menu. Details on marking the data can be found here.
|
| Bulk operations |
The numeric editor also provides some basic bulk operations, such as finding and marking the minimum, and maximum values, or marking data above or below a threshold. These commands can be started by clicking the appropriate buttons in the top panel of the editor. |
|

 Features of DataLab
  Editing Data
  Data
Data  Numeric Data Editor


