Sample
program: |
The following sample code lets you select two variables of the currently loaded dataset. The frequency distributions of the two variables are then displayed and compared by means of a chi2-test.
program FrequDistribution;
const
PAGE = 1; // chart page
NBINS = 100; // number of bins of the frequency distribution
(******************************************************************************)
procedure ListDistributions (Distri1, Distri2: TIntArray);
(******************************************************************************)
var
i : integer;
begin
with ChartBook.Tables[PAGE] do
begin
NrOfRows := length(Distri1);
for i:=1 to length(Distri1) do // lines
Elem[1,i] := IntToStr(Distri1[i-1]);
for i:=1 to length(Distri2) do // lines
Elem[2,i] := IntToStr(Distri1[i-1]);
end;
end;
(******************************************************************************)
procedure DrawDistribution (Distri: TIntArray; Color: TColor; FirstBin,
Binwidth, Offset: double);
(******************************************************************************)
var
i : integer;
begin
with ChartBook.Charts[PAGE] do
begin
DataColor := Color;
for i:=1 to length(Distri) do // lines
begin
MoveTo (FirstBin+Binwidth*(i-1), 0+offset);
DrawTo (FirstBin+Binwidth*(i-1), Distri[i-1]+offset);
end;
MoveTo (FirstBin, Distri[0]); // envelope
for i:=1 to length(Distri) do
DrawTo (FirstBin+Binwidth*(i-1), Distri[i-1]+offset);
AutoRange (1,4);
Update;
end;
end;
(******************************************************************************)
// main program
(******************************************************************************)
var
Data : TDouble2DArray;
v1, v2 : integer;
FrequDist1 : TIntArray;
FrequDist2 : TIntArray;
Underflow,
Overflow,
MaxCnt : longint;
Chi2, p : double;
df : integer;
nObs, nExp : integer;
min1, max1 : double;
min2, max2 : double;
minidx, maxidx : integer;
offset : double;
Mask : TBool2DArray;
SelVars : TIntArray;
begin
if SelectVariables (DStore, false, [], 'Please select the first variable',
SelVars) = 0 then
begin
v1 := SelVars[0];
Resize2DArray (data, DStore.NrOfColumns, DStore.NrOfRows);
DStore.CopyDataTo2DArray (Data,0,0,0,0,0,0);
MinMaxMatrix (Data, v1-1, 0, v1-1, DStore.NrOfRows-1, min1, max1);
if SelectVariables (DStore, false, [], 'Please select the second variable',
SelVars) = 0 then
begin
v2 := SelVars[0];
MinMaxMatrix (Data, v2-1, 0, v2-1, DStore.NrOfRows-1, min2, max2);
MinMaxVector ([Min1, min2, max1, max2], 0, 3, min1, max1, minidx, maxidx);
if v1 = v2 // displace plots if the distributions
then offset := 0.01 // come from the same variables
else offset := 0.0;
ResizeBool2DArray (Mask, DStore.NrOfColumns, DStore.NrOfRows);
FillBoolMatrix (Mask, false);
if FrequDistOfMatrix (Data, Mask,
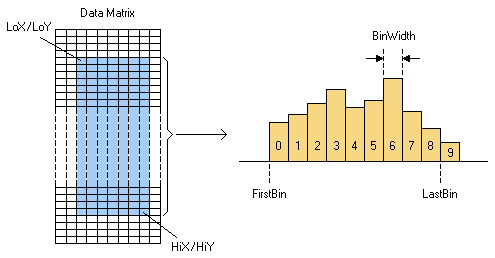
v1-1,0,v1-1,DStore.NrOfRows-1, // LoX, LoY, HiX, HiY,
min1, max1, // FirstBin, LastBin,
(max1-min1)/NBINS, // BinWidth,
FrequDist1,
Underflow, Overflow, MaxCnt) = 0 then
begin
ChartBook.Reset;
ChartBook.Configure
(PAGE, // page 1
true, true, false, // only the chart is visible
250, 250); // default width & height
ChartBook.TabCaption[PAGE] := 'Frequency Distribution';
with ChartBook.Charts[PAGE] do
begin
Reset;
GridStyle := gsDotLines;
GridColor := clSilver;
ScalePropsY[1].ShortTicks := false;
end;
DrawDistribution (FrequDist1, clBlue, min1, (max1-min1)/NBINS, -offset);
if FrequDistOfMatrix (Data, Mask,
v2-1,0,v2-1,DStore.NrOfRows-1, // LoX, LoY, HiX, HiY,
min1, max1, // FirstBin, LastBin
(max1-min1)/NBINS, // BinWidth,
FrequDist2,
Underflow, Overflow, MaxCnt) = 0 then
begin
DrawDistribution (FrequDist2, clRed, min1, (max1-min1)/NBINS, +offset);
PerformChi2DistComp (FrequDist1, FrequDist2, Chi2, p, df, nobs, nexp);
ChartBook.Charts[PAGE].Caption := 'Frequency Distribution of Variable '+
IntToStr(v1)+': '+DStore.ColName[v1]+' (red) and Variable '+
IntToStr(v2)+': '+DStore.ColName[v2]+' (blue). p = '+
SigDigStr(p,12,4,true);
ListDistributions (FrequDist1, FrequDist2);
end;
end;
end;
end;
end.
|
 Programming DataLab