Multi-Class Linear Discriminant Analysis
| Command: |
 Math -> Linear Discriminant Analysis -> Create Classfier... Math -> Linear Discriminant Analysis -> Create Classfier... |
The command Math/Linear Discriminant Analysis/Perform Multi-Class Analysis... calculates the directions for plotting the data in a way that the displayed distance between the classes is a maxmimum and the distance between class members is a minimum. The class numbers have to be encoded as row attributes of the data matrix and must start with 1 and must be contiguous (use the class editor to remap the class numbers if necessary).
After selecting the variables to be used for the analysis you have to click the calculate button in order to start the analysis. The results are displayed on several tab sheets:
- Summary: The summary tab shows the found optimal directions and their information content. Note that directions (eigenvectors) which do not contain any information are not displayed.
- Loadings: Shows the weights for the discriminating components in a graphical form (the numeric values can be found in the "Details" tab.
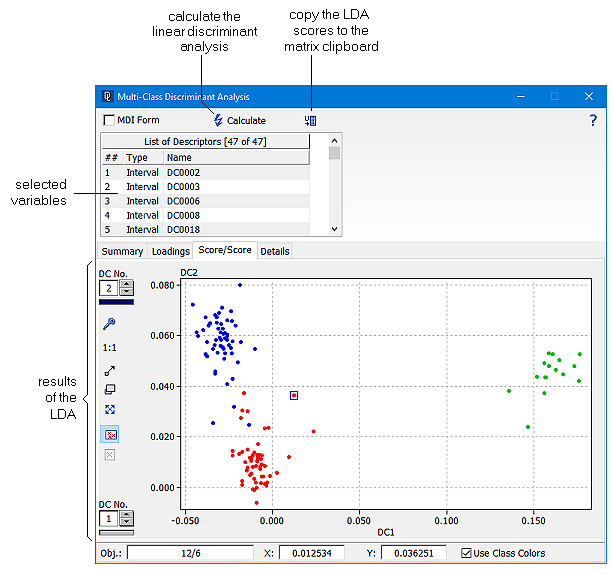
- Score/Score: Displays the data projected on two discriminating components (DC1 vs. DC2 nornmally deliver the best results). If there is only one discriminating component the diagram displays the scores of this component against the object index.
- Details: Lists the numeric details of the analysis. In particular the following information is available:
Summary: class means and class standard deviations of all variables
Discriminating Power: the discriminating power of the individual components is indicated by the percent variance covered by this particular component and the F and p values of a 1-factor ANOVA of the scores (p values below 0.05 are considered to be significant)
Eigenvalues: the multi-class LDA is carried out by means of an eigenvalue analysis.
Loadings: the weight factors of all variables for each discriminating componen
Scores: the resulting data after rotating the data by means of the loading matrix.
|
 Features of DataLab

