| DataLab is a compact statistics package aiming at exploratory data analysis. Please visit the DataLab Web site for more information.... |
Home  Features of DataLab Mathematical/Statistical Analysis Modelling PCA Features of DataLab Mathematical/Statistical Analysis Modelling PCA |
||||||||||
See also: Loading/Loading Plot, Loadings, Scores, Score/Score Plot, Principal Component Regression, Summary, Bi-Plot, Details, Kohonen Map, Multi-Class Linear Discriminant Analysis, TFrmPCA
 |
||||||||||
  |
||||||||||
PCA
The command Math/Principal Component Analysis... calculates the principal components (PCs) of a set of variables and allows to perform exploratory data analysis based on PCs. In order to calculate the PCs the user first has to select the variables which are to be used for the PCA by clicking into the list of descriptors and selecting the appropriate ones. Clicking the "Calculate" button performs the PCA and displays the results in the lower part of the PCA window:
Please note that the principal component analysis has to be repeated whenever either the list of variables or the scaling mode is changed. Depending on the structure of the data and/or the intended interpretation of the results it may be necessary to adjust the scaling mode:
The results of the PCA are presented on seven tabs at the bottom of the window: Summary, Loadings, Scores, Loading/Loading, Score/Score, Bi-plot, and Details. Some of these windows can be used to mark one or more data points and to delete these points from the data matrix (see description of the individual pages). Further, a snapshot of any chart can be created by selecting the command Copy Chart to Clipboard or Copy Chart to BMP File from the context menu. The scores of the PCA can be copied to the matrix clipboard by clicking the When moving the mouse over the charts, the item closest to the mouse is indicated by a square around the item. Its coordinates and the corresponding identifier are shown in the panel at the bottom of the PCA window. |
||||||||||
 Math -> Principal Component Analysis...
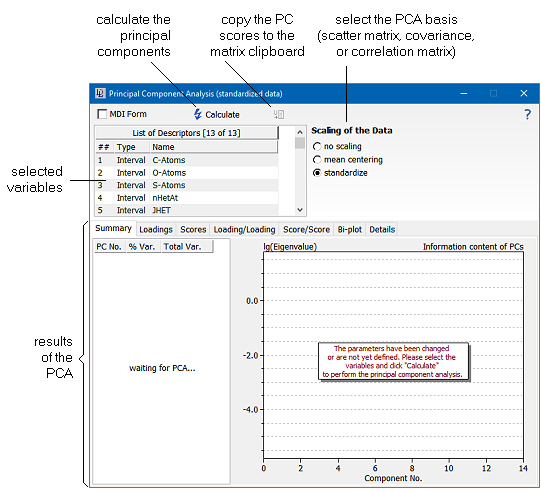
 button.