| DataLab is a compact statistics package aiming at exploratory data analysis. Please visit the DataLab Web site for more information.... |
Home  Features of DataLab Mathematical/Statistical Analysis Modelling PCA Score/Score Plot Features of DataLab Mathematical/Statistical Analysis Modelling PCA Score/Score Plot |
|||||||||||||||||||
See also: PCA, PCA Loading/Loading Plot, PCA Loadings Plot, PCA Scores Plot
 |
|||||||||||||||||||
  |
|||||||||||||||||||
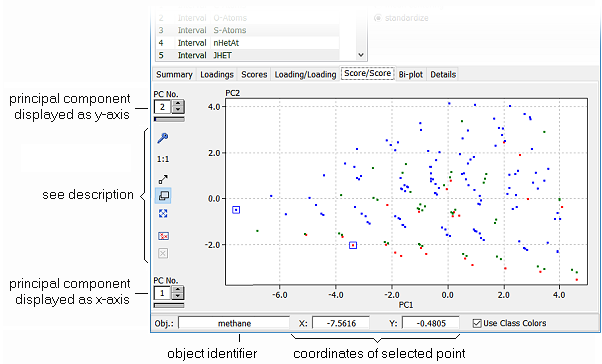
PCA Score/Score PlotThe tab Score/Score shows the data projected onto a plane which is spanned by any of two principal components.
Left to the score plot there are several controls for changing the display options. In addition to the selection boxes for choosing the principal components to be displayed there are several buttons which provide the following functionality:
|
|||||||||||||||||||

 Window: any rectangular region of the chart can magnified to fit the full area of the chart by simply pressing and holding down the left mouse button at one corner of the region. Moving the mouse now shows a rubber band rectangle. The area of the rectangle is blown up to the full chart area when the left mouse button is released.
 Drag: the scale of the chart can be increased or reduced by pressing and holding the left mouse button. The scaling factors of the x and y axes are changed in proportion to the movement of the mouse (up and right = magnify, left and down = reduce).
 Pan: the visible part of the chart can be shifted by pressing and holding down the left mouse button. The chart follows the mouse movement which results in panning the visible window across the data.
 Mark Data: Data may be marked by activating this option. In order to mark one or more data points you have to draw a rectangle around these points. Marked data are indicated by red crosses. A detailed description can be found in the section "
