| DataLab is a compact statistics package aiming at exploratory data analysis. Please visit the DataLab Web site for more information.... |
Home  Features of DataLab Editing Data Marking the Data Features of DataLab Editing Data Marking the Data |
||||
See also: Numeric Data Editor, Context Menu of the Numeric Editor, The Color of Markings, CountMarkedCellsInColumn, CountMarkedCellsInRow
 |
||||
  |
||||
Marking the DataIn order to mark data, DataLab offers several Methods:
Marking the Data in the Numeric TableIn general, the data can be marked by two different designators, called type A and B. Type A is indicated by red numbers, type B by blue ones. If a cell is marked both as type A and type B the cell is displayed in magenta color. Cells which have been marked in one window retain their mark types in all other windows.
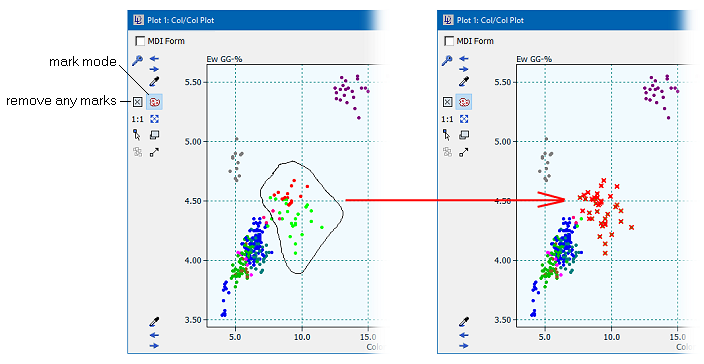
In order to mark a particular range of cells you first have to select this range and then click one of the buttons ( Marking the Data by Graphic MeansThe cells of the data matrix can be marked directly in various diagrams, among them are the plot window, various windows of the simple and multiple regression, and in the principal component analysis window.
Thereafter you can draw a rectangle or lasso line around the data to be marked. Marked data are indicated by red or blue crosses. If a data point is marked both blue and red it is displayed in magenta. Already marked data can be unmarked by clicking the "unmark all" button (  ). Please note that the marking process is actually an inverting operation (marked data will be unmarked, unmarked data will be marked). This way you can selectively unmark specific data points in a cloud of already marked points. ). Please note that the marking process is actually an inverting operation (marked data will be unmarked, unmarked data will be marked). This way you can selectively unmark specific data points in a cloud of already marked points.
|
||||
 or
or  ) in the command field of the editor. Minimum and maximum, and all values above or below a threshold can also be marked by using the respective buttons in the command field. Further, a certain percentage (or, alternatively, an absolute number) of selected cells can be marked randomly.
 red marks within a rectangle
 blue marks within a rectangle
 red marks within a lasso line
 blue marks within a lasso line
 ) in the