Epina DataLab
Calculation of Dendrograms
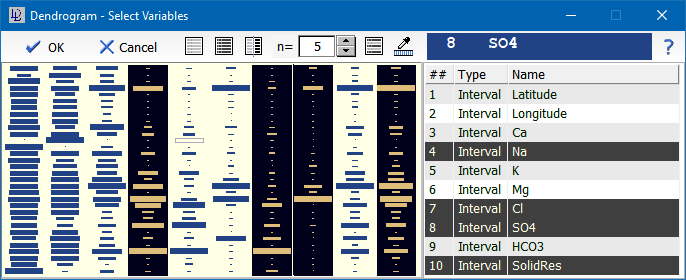
Cluster analysis is an efficient tool in order to uncover relationships in multidimensional data spaces. The following example looks for similarities of mineral waters, which have been characterized by their chemical constituents. After starting the cluster analysis, you first have to select the variables which are to be used for the definition of the data space:
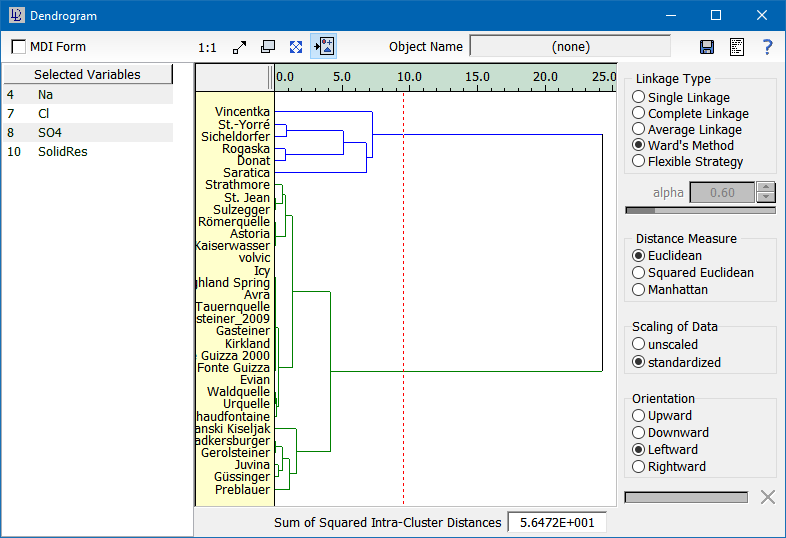
DataLab then calculates the dendrogram, using the currently selected parameters. These include the calculation methods, the distance measure, and the scaling of the data.
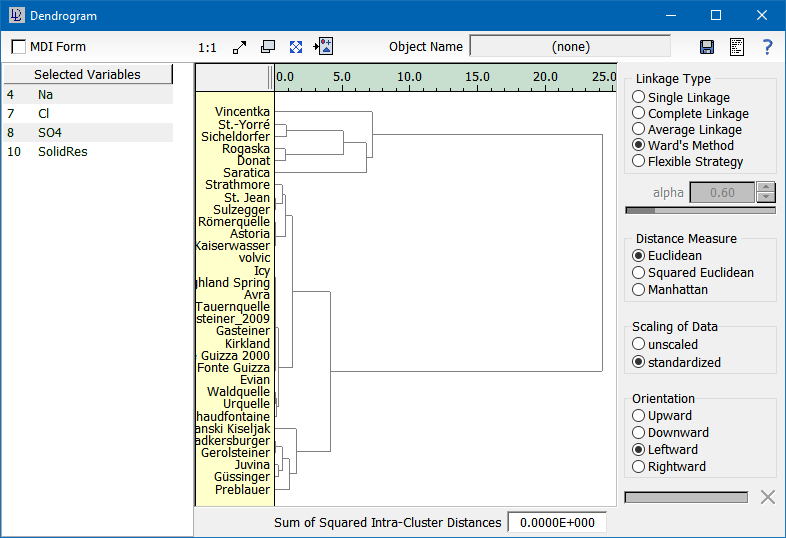
The calculated dendrogram can be used to classify the data. This can be achieved by specifying a minimum distance (dotted red line) which is intended to separate the clusters from each other. When clicking at the proper position the data is classified - each object is assigned a class number, the dendrogram is displayed using the corresponding class colors.