Epina DataLab
Features
Help & Support
Application Examples
Overview
Linear Regression
Digitizing Curves
t-Test
Dendrograms
Multiple Regression Model
Research done with DataLab
Download
Data Repository
Release History
Latest Changes
Purchase

Curve Digitizer

DataLab is well suited for digitizing measured curves which have been published as a plot, or for digitizing images, such as microscopic pictures, satellite images, or similar graphical data. Suppose you have an infra-red spectrum recorded on paper many years ago. A scanned images of the spectrum looks like this:


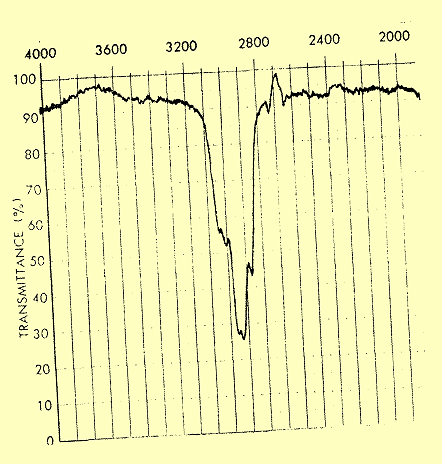
In order to receive a digital spectrum you simply place points on the measured line which are automatically connected by line segments.

These points can be transformed into the coordinate space of the paper plot by calibrating the grid on the paper (which is simply specifying three or more points on the grid). The calibrated data can then be transferred into the data matrix of DataLab. Plotting the calibrating value results in the following spectrum: