 Epina DataLab
2-Sample t-Test
Suppose, you have to test whether the participants of a training camp show different reaction times before and after the training. In order to check whether there is a significant difference between the two tests, we repeat the reaction test several times and perform a t-test to compare the reaction times. The t-test, however, has two requirements - the data has to be normally distributed, and the variances have to be the same. Thus we have to carry out three different tests - a Shapiro-Wilk test for normality, an F-test for equal variances, and finally the t-test (or the Welch test in the case of unequal valiances) for equal reaction times.
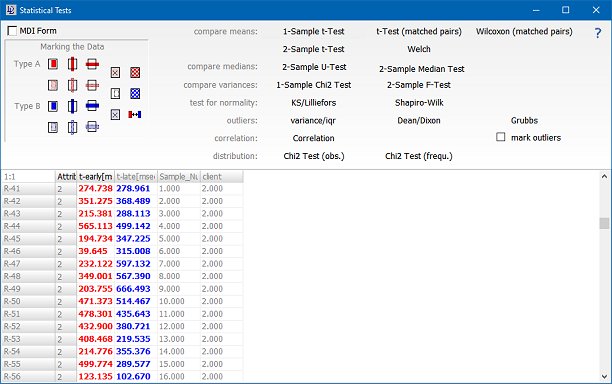
All three tests can be carried out easily by DataLab. We first start the statistical tests and tag the data to be compared (shown in red and blue).
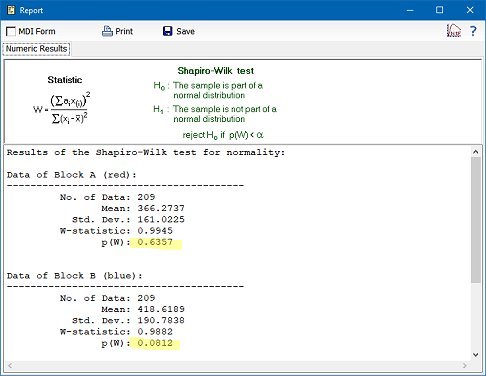
Next we perform the Shapiro-Wilk test for normality, which shows that the requirement of normal distributions is fulfilled:
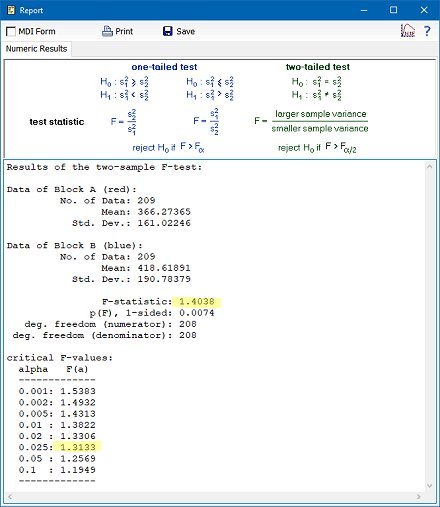
Now we have to check for equal variances by applying an F test:
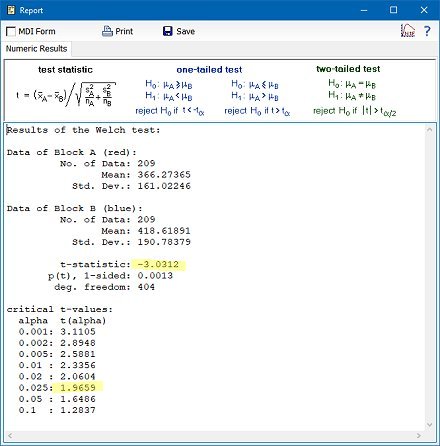
We now see that the Welch test has to reject the null hypothesis that the means are equal, which actually means that the training had indeed an effect on the reaction times.