 Epina DataLab
Multiple Regression Model
Suppose you want to create a mathematical model which is able to estimate the boiling points of chemical substances from their structural parameters. Such a model would have the benefit of being able to approximately know the boiling point of a substance without having physical access to it (even if the substance has not yet been synthesized, you can already estimate its boiling point).
For that purpose we need a set of known data containing the structural parameters (which can be calculated from the chemical structure) and the corrsponding boiling points. Our sample data set contains the boiling points of 185 substances, each of which is characterized by 12 structural parameters.
When creating the model one of the most important questions is to find out which of the 12 independent variables (structural parameters) are suited best to set up the model. DataLab offers the following variable selection methods: forward selection, backward elimination, stepwise regression, and the test of all possible combinations of independent variables. In order to perform the variable selection we call the command "Math/Multiple Linear Regression/Variable Selection" (button  in the DataLab toolbar).
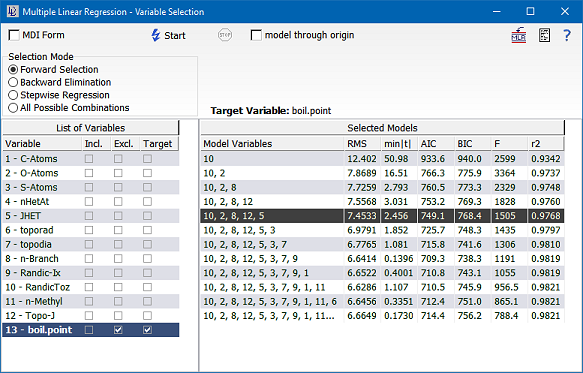
 ) in order to calculate the model:

The details on the results of the multiple regression can be found in the tab "Details":
============================================================
Multiple Linear Regression: d:\datalab\data\boilpts.idt
============================================================

Number of Objects .............: 185
Number of Input Variables .....: 5
Degrees of Freedom ............: 179
Target Variable ...............: [13]  boil.point

Mean of Target Values .........: 132.714054
Std.Dev. of Target Values .....: 48.223876
Mean of Calculated Values .....: 132.714054
Std.Dev. of Calc. Values ......: 47.660251

Standard Dev. of Residuals ....: 7.4533
Quality of Fit ................: 0.9768
Adjusted Quality of Fit .......: 0.9762
F-Statistic ...................: 1504.731 (p=0.0000)
Durbin-Watson Statistic: 1.27485
   Critical values (alpha=0.05): DL=1.69295  DU=1.82670
   *** There is serial correlation in the residuals.

 ------------------------------------------------------------
  ANOVA        DF  sum of squares   mean square      F
 ------------------------------------------------------------
  Regression    5    4.17956E+05    8.35912E+04   1504.731
    Residual  179    9.94385E+03    5.55522E+01
       Total  184    4.27900E+05
 ------------------------------------------------------------

Regression coefficients:
   Col-#    Var-Name      Coefficient +/- Std.Err.(coeff)   t-Test  alpha
 ------------------------------------------------------------------------
     -  INTERCEPT     -7.0960574E+01 +/- 5.5103328E+00   -12.878  0.0000
    10  RandicToz      7.6873275E+00 +/- 1.1242126E-01    68.380  0.0000
     2  O-Atoms       -1.3123226E+01 +/- 7.9273468E-01   -16.554  0.0000
     8  n-Branch      -4.6668763E+00 +/- 1.1711391E+00    -3.985  0.0001
    12  Topo-J         7.2078089E+00 +/- 2.3775368E+00     3.032  0.0028
     5  JHET          -8.5553223E-01 +/- 3.4827518E-01    -2.456  0.0150