| DataLab is a compact statistics package aiming at exploratory data analysis. Please visit the DataLab Web site for more information.... |

Home  Introduction Introduction  Matrix Survey Plot Matrix Survey Plot |
||||||||||||||||||||||
See also: Resizing the Data Matrix, Editing Nominal and Ordinal Values, Matrix Clipboard, Load Data Matrix from Clipboard, UpdateDescription
 |
||||||||||||||||||||||
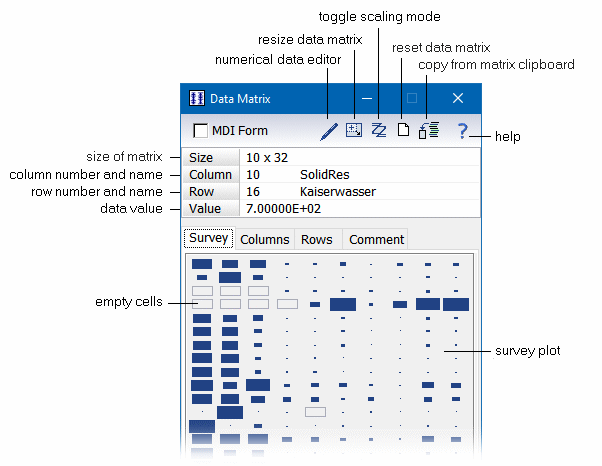
Matrix Survey PlotThe matrix viewer is the central door to get access to the data matrix. The matrix viewer is always open and contains (besides some often required shortcut keys) a four-pane window which gives access to the various aspects of the stored data (graphical survey, column and row identifiers, and a comment/description of the data). The data matrix is displayed in graphical form on the survey pane by a bird's-eye view. The values of the matrix cells are shown by small colored rectangles whose sizes are proportional to the values they represent.
The matrix viewer provides a the following shortcut keys:
|
||||||||||||||||||||||


